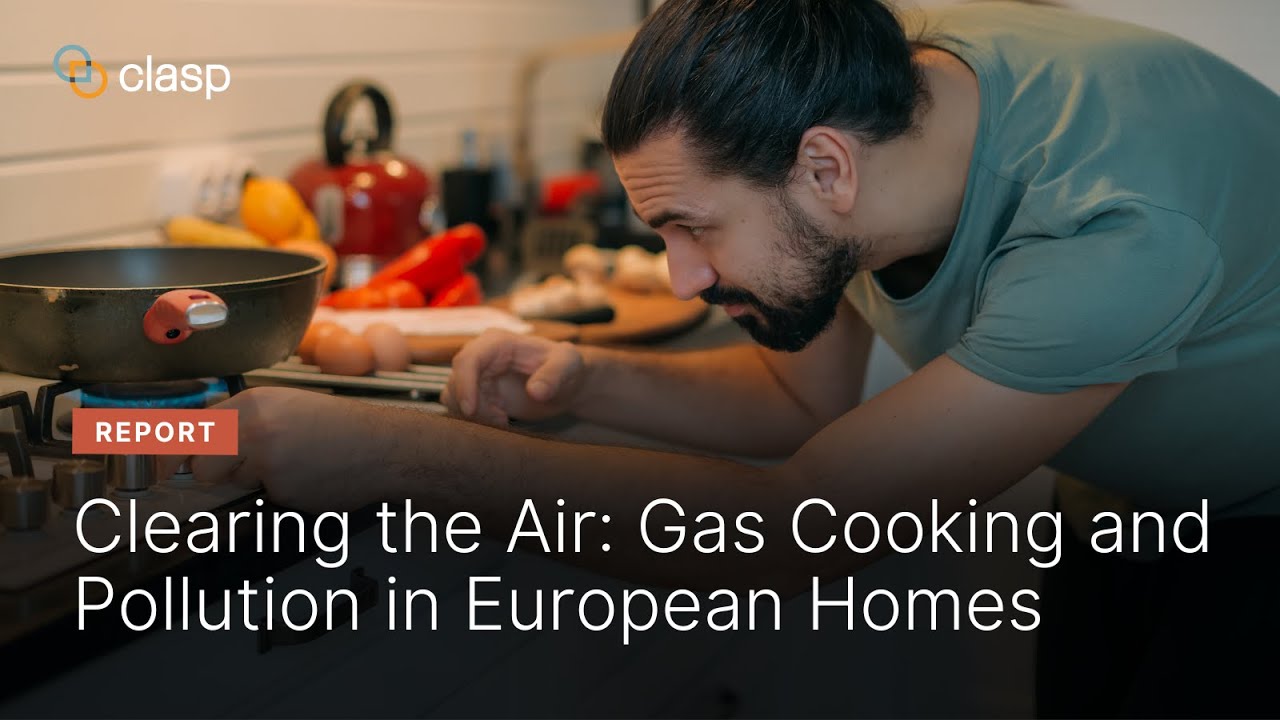
Clearing the Air: Gas Cooking and Pollution in European Homes
Summary
New study confirms gas cooking appliances release harmful pollutants into homes across Europe, exceeding benchmarks set by World Health Organization (WHO) guidelines and EU and UK limits for outdoor air pollution.
Download Report
- CLASP Report "Clearing the Air: Gas Cooking and Pollution in European Homes"
- TNO Report "Health Effects in Europe from Cooking on Gas - Phase II Field Study"
- (DE) Die Luft klären: Gaskochen und Umweltverschmutzung in europäischen Haushalten
- (ES) Cocinas de gas y contaminación en los hogares europeos
- (FR) Cuisiner au gaz : Résultats d’une étude paneuropéenne sur la qualité de l’air intérieur
- (HU) Gázzal való főzés és légszennyezés az európai otthonokban
- (IT) Cucina a Gas e Inquinamento nelle Case Europee
- (NL) De lucht klaren: koken op gas en verontreiniging in de Europese woning
- (RO) Gătitul cu gaz: Constatări ale unui studiu paneuropean de teren privind calitatea aerului din interior
- (SK) Plynové varenie a znečisťovanie ovzdušia v európskych domácnostiach

Our research reveals the severity of air pollution caused by gas cooking appliances in homes across Europe. Empowering people with knowledge on the health risks of these products is essential, and they need resources to upgrade to cleaner and healthier hobs and ovens. In turn, governments must protect public health, tackling air pollution at the source and supporting the transition to cleaner cooking.Nicole Kearney
CLASP Europe Director
In collaboration with the Netherlands Organisation for Applied Scientific Research (TNO) and Opinium Research, CLASP conducted a study across seven European countries in 2023 to assess the impact of gas cooking on indoor air quality. The research involved monitoring in-home air quality in gas- and electric-cooking households, collecting household and cooking behaviour data, and analysing indoor pollutant concentration levels.
The report tackles several critical questions:
- What are the levels of indoor air pollution in households with gas cooking appliances and how do they compare to households that cook with electric appliances?
- How do these pollution levels compare to established mandatory outdoor air quality standards as well as pollution levels recommended by the WHO?
- Is ventilation enough to mitigate the health risks linked with gas cooking, or is a transition to cleaner cooking technologies necessary?
The report’s key findings provide a compelling call to action:
- Gas cooking often results in indoor air pollution that exceeds WHO air quality limits, putting citizens at risk of severe health issues.
- Many households with gas cooking appliances exceed WHO air quality guidelines for nitrogen dioxide (NO2).
- Electric-cooking households, in contrast, enjoy significantly better indoor air quality, free from NO2 pollution caused by kitchen appliances.
- Ventilation alone is insufficient to mitigate the pollution, necessitating a transition to cleaner electric cooking.
To safeguard public health, it’s essential to educate people about the health risks associated with gas appliances and provide them with resources to transition to cleaner and healthier cooking technologies. CLASP calls for collaborative efforts from governments, industry, civil society, healthcare providers, and individuals to improve indoor air quality across Europe.
Additional Resources
TNO Report: Health Effects in Europe from Cooking on Gas – Phase II Field Study
Executive Summary Translations
Dutch, French, German, Hungarian, Italian, Romanian, Slovak, Spanish
Press Releases
Dutch, English, French, German, Hungarian, Italian, Romanian, Slovak, Spanish.
Report Figures Available for Download
Figure 1. Gas cooking appliances directly emit harmful pollutants, whereas PM2.5 is emitted by the process of cooking food
Figure 2. Criteria for household monitoring selection
Figure 5. Comparison of average NO2 concentrations in gas- and electric-cooking homes
Figure 6. Average NO2 concentrations per country and per cooking method in different rooms
Figure 9. Average exceedance of WHO and EU/UK NO2 limit values in gas- and electric-cooking homes
Figure 10. Average number of exceedance days of the WHO daily guideline value during the 13-day measurement period
Figure 11. Highest hourly CO concentrations found in the kitchen, per country and per cooking method
Figure 12. Average PM2.5 concentrations in the kitchen, per country and per cooking technology
Figure 14. Overview of ventilation types recorded in the study
Figure 15. Comparison of average indoor-attributed NO2 concentration throughout the home, by cooker type
Figure 16. Average PM2.5 concentration in kitchen for all homes cooking on gas and electric hobs
Figure 17. Reasons for using ventilation in the kitchen: results from a 2023 CLASP consumer survey
Figure 18. Average NO2 concentrations in the Netherlands in the kitchen, living room, bedroom, and outdoors
Figure 19. Map of gas- and electric-cooking households in the Netherlands showing NO2 levels
Figure 21. Average NO2 concentrations in Italy in the kitchen, living room, bedroom, and outdoors
Figure 22. Map of gas- and electric-cooking households in Italy, based on severity of NO2 levels
Figure 24. Average NO2 concentrations in Spain in the kitchen, living room, bedroom, and outdoors
Figure 25. Map of gas- and electric-cooking households in Spain, based on NO2 levels
Figure 27. Average NO2 concentrations in France in the kitchen, living room, bedroom, and outdoors
Figure 28. Map of gas- and electric-cooking households in France, based on severity of NO2 levels
Figure 30. Average NO2 concentrations in Slovakia in the kitchen, living room, bedroom, and outdoors
Figure 31. Map of gas- and electric-cooking households in Slovakia, based on severity of NO2 levels
Figure 33. Average NO2 concentrations in Romania in the kitchen, living room, bedroom, and outdoors
Figure 34. Average corrected NO2 concentrations in Romania, taking into account higher levels of outdoor air pollution
Figure 35. Map of gas- and electric-cooking households in Romania, based on severity of NO2 levels
Figure 37. Average NO2 concentrations in the United Kingdom in the kitchen, living room, bedroom, and outdoors
Figure 38. Map of gas- and electric-cooking households in the United Kingdom, based on severity of NO2 levels
Guidance Materials for Participating Households
Field Testing Equipment Overview
Field Testing Equipment Installation Guide
Household Recruitment Questionnaire
Instructional Videos for Participating Households: Dutch, English, Italian, French, Romanian, Slovak, Spanish
Visit our Cook Cleaner Europe page to view additional resources on gas and electric cooking.

